Financial Model
Financial Model Template
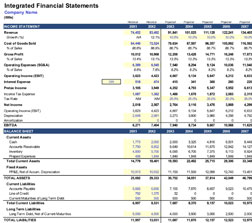
Making a financial model template encourages entrepreneurs to very carefully plan out how their company will function, as well as how customers get introduced to goods and services, how profits are made, and how costs will be handled. Intelligent financial modelling is an irreplaceable skill when raising start-up money.
We know it can seem like the best route would be to outsource financial modelling. But if you handle the work yourself, you have a greater ability to organize what you need to work on and how you’re going to achieve your goals. That’s why we recommend building your own financial model template. It’ll help you calculate figures more accurately and simulate how the business will handle itself under various conditions.
How To Get Started?
In order to begin constructing a template, we’ve come up with a list of steps to develop a sound financial model that’s appropriate for your business so that you can be prepared for the future.
Understandably, you might not be starting out with a lot of knowledge about what you need to do. That’s why we recommend starting with the Top Down Model. It takes a look at the entire market before trying to figure out where your company fits in and where their best customer base might be.
When it comes to constructing a top down model, you’ll need to figure out what size the market is and what sort of data is relevant to your business before you start crunching numbers.
For example, let’s say your company builds an app for the millions of iPhone users out there. In that case, you might want to find out how many customers have bought additional apps for their iPhone. If a quarter of all users buy an app every month, then you have a potential customer base of tens or hundreds of thousands of people.
KPIs, or Key Performance Indicators, and other measurements will differ depending on what industry and socio economic climate your business operates in. For your convenience, we’ve compiled a list of metrics software developers commonly use so you can see real examples.
ARPU – Average Revenue Per User
ARPU is classified as all of the revenue collected divided by how many users there are in a given period of time ( a quarter, a year, etc.) This is an important calculation because it shows how important each user of your service is. Their value is taken into account whether they’ve bought subscriptions, clicked on advertisements, or anything else.
When investors are examining companies which haven’t yet generated revenue, they compare metrics which predict how well these companies will do, versus, the established ARPU data from other companies which are already up and running. A billion-dollar business might produce an ARPU of about ten dollars in a good fiscal quarter.
CAC – Customer Acquisition Cost
The CAC is how much must be spent to bring in new users. It can get messy determining exact figures for this metric.
Often times, costs such as discounts and the fees for referrals fail to be included in the CAC. Another issue is processing CACs as if they were blended – meaning that users who have found and accessed your platform organically, or without you exerting time or effort on them. Blended CACs make it harder to key in on how much money you’re making from users within a given period.; therefore, paid-only CACs are viewed as superior for determining a company’s prospects or profitability.
LTV – Customer Lifetime Value
This metric represents the current value of the incoming total profit generated from a customer over the entire time they consort with your business. In other words, the LTV seeks to predict how much you will ever profit from a user based on how much profit they’re generating now. This metric is calculated after the CAC has been figured out. Here’s a good way to determine LTV:
– Take the monthly revenue from a customer. This is the average value of every order made, multiplied by how many orders are actually made.
– Find the margin of contribution per customer. This is how much profit a customer generates, minus certain customer-related costs such as selling, operational, and administrative costs.
– Calculate the average longevity of a customer by dividing 1/Contribution Margin per month.
– The Lifetime Value will be found as the contribution margin multiplied with the average longevity. Try to use data from at least 12 or 24 months.
As a side note, if you’re working with a new business that has little hard data, you can supplement your calculations with historical values from other, established companies.
Manage A Gap Between Your Feelings And Your Decisions
Successful financial models wither in the face of assumptions. The only constant factor in business is change, and you need to make sure you’re making room for this inevitability in everything you do.
Beyond making assumptions, makes lists of profit, losses, the cost of goods sold, and more, Organize them well and study them carefully before making decisions. Consider questions like: How much will this cost? When will I need to pay for this?
.
Financial Modeling Excel
You’ve been warned that managing finances for your business can be challenging, but don’t stress. Exceltemplates.net has financial modeling Excel templates for those who don’t want to start figuring things out from scratch. Excel is perfect for inputting data and then using advanced models and calculations to help you to make predictions about the best decisions to make for your business
DOWNLOAD
