Monthly Profit and Loss Statement Template
A business usually measures its success by the profit it makes. But while gaining profit is the primary and obvious goal, it’s equally important to measure losses that might occur. This way, you can prevent situations that can be unprofitable or even lethal for the company.
What is profit and loss projection and why is it important?
No matter what industry you’re in, projecting the profit or loss of your business is the best way to avoid financial crises.
Profit and loss projections outline the profitability of your business. Simply put, it demonstrates how good (or bad) your business is at making money, so you can identify what changes you need to make to get from your current financial position to where you want to be.
Creating a Projected profit & loss statement will allow you to analyze the value of your business and forecast its future performance based on current and assumed (but realistic) data.
Projected Monthly Profit & Loss Statement Template for Excel
This Projected Monthly Profit & Loss Template for Excel will save you the time and trouble of coming up with your own Profit & Loss Projection Statement.
Stay on top of your business’ profit and loss margins!
Download this 12-month Profit and Loss Projection Template today!
About the Template
The Projected Monthly Profit & Loss Statement is made up of three worksheets.
Sheet 1: Revenue
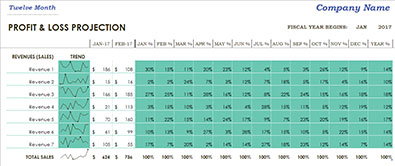
The Revenue sheet contains the rundown of all your sources of revenue. Using the amounts entered for each type of revenue, the template will calculate your total monthly and annual sales.
Cells labeled “Revenue 1, Revenue 2,” etc. should be changed to the actual names of your sales categories.
On the right half of the sheet, you’ll find monthly % columns (Jan %, Feb %, etc.) and a yearly % column, which display the percentage contributed by each category to the total monthly and annual sales.
Sheet 2: Cost of Sales
The Cost of Sales sheet includes expenses directly related to producing or purchasing the business’ products and services – raw materials, packaging, shipping, etc.
Cells labeled “Cost 1, Cost 2,” etc. should be changed to the actual names of cost categories.
Based on the figures you entered for each cost category, the template will calculate the total cost of sales for each month and the annual cost of sales.
On the right half of the sheet, you’ll find monthly % columns (Jan %, Feb %, etc.) and a yearly % column, which show the monthly and annual cost of sales percentage each category takes up.
The Gross Profit is calculated by subtracting the Total Cost of Sales from the Total Sales in Sheet 1.
Sheet 3: Expenses
The Expenses Sheet holds all necessary operating expenses, which include (but not limited to) salary and payroll expenses, rent, utilities, insurance, taxes, advertising, etc.
You can edit the expense categories to better suit your type of business and accounting system.
On the right half of the sheet, you’ll find monthly % columns (Jan %, Feb %, etc.) and a yearly % column, showing what percentage each expense category takes up in your total monthly and annual expenses.
The Net Profit is calculated by subtracting the Total Operating Expenses from the Gross Profit in Sheet 2.
How to Use
- On the first sheet labeled Revenues, change the sections marked “Revenue 1, Revenue 2…” to specific sales categories or specific products.
- Enter the monthly sales for each category.
- The spreadsheet will add up your total monthly and annual sales and show what percent of total monthly and annual sales is contributed by each revenue category.
- On the second sheet labeled Cost of Sales, change the sections marked “Cost 1, Cost 2…” to actual cost categories.
- Enter the monthly cost of sales for each category.
- The spreadsheet will calculate your total sales cost per month and for the year and your Gross Profit.
- On the third sheet labeled Expenses, enter the monthly expenses for each category. You can change the pre-written text to items or expense categories that you commonly use in your business.
- The spreadsheet will calculate your total monthly and yearly expenses and your Net Profit.
*** All three sheets have an IND% column, which stands for INDUSTRY AVERAGES. This is the average sales and cost factors for firms the same size as yours in your industry. You can get industry average data from industry associations, Chambers of Commerce, or in the Statement Studies book published by Robert Morris Associates.
While it is unlikely that your sales and expenses will be exactly in line with industry averages, the data can help determine which expenses are way out of line and compare your ratios with similar firms.
*** The most important rule to remember when creating income projections is that your projections should simulate your financial reality as much as possible.
Benefits of Using Excel for Profit & Loss Projection
Excel templates provide compelling advantages for SMEs looking for flexible, versatile and cost-effective accounting, business reporting, and financial forecasting solutions.
- The templates are completely customizable. You can edit and adjust them to better fit your business’s needs and improve them as your venture grows.
- Excel templates are packed with features but void of complex systems that your small business may not even need.
- It’s a simple, one-off cost structure. The Projected Profit & Loss Statement Template can be downloaded for free. Other Excel templates may demand a one-time fee, but they’re usually very cheap. Most importantly, no subscriptions or contract sign-ups are required.
- Most people already know the basics of using Excel, so there’s no need to spend time or money training employees how to use it.
What are you waiting for?
Click here to download the Excel Projected Profit & Loss Statement Template.
DOWNLOAD
